UK House Price Map 2026: Growth by Region and Council
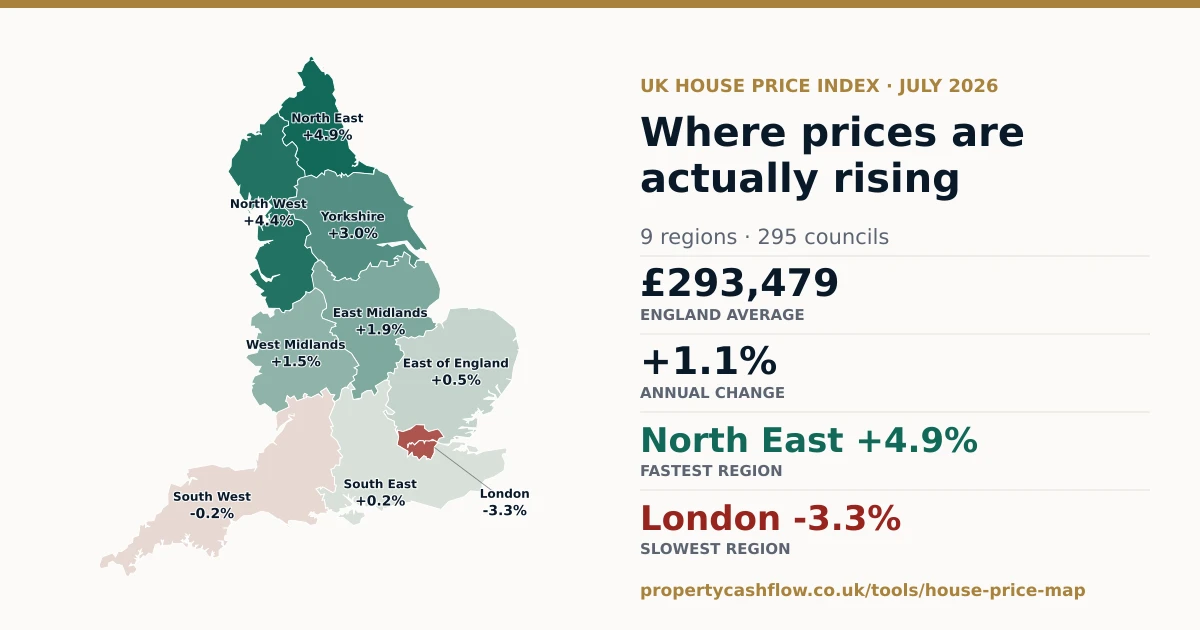

Are UK house prices rising or falling in 2026? Both — and which one you are living through depends entirely on the council you buy in. In the twelve months to July 2026, the official index has Trafford up +9.6% and Westminster down 20.7%. Averaging those two into one national headline produces a number that describes nobody's property.
So I built the map below, and I put every council in England on it.
It runs on the UK House Price Index — the official one, from HM Land Registry and the ONS, built from completed sales registered at the Land Registry. Nine regions, 295 local authorities, four views: annual change, monthly change, average price, and what first-time buyers are actually paying.
The map: house price growth by region and council
Click any region to drop inside it and see its councils. Or type your council into the search box — it will find it and zoom to it.
What the national number hides
England's average is £293,479, up +1.1% over the year. That is the number that makes the news. It is also the least useful number on this page.
Underneath it, the country splits almost perfectly north to south. The North East is up +4.9% and the North West +4.4%. Yorkshire is up +3.0%. Then it fades: the East of England +0.5%, the South East +0.2%, the South West -0.2% — and London down 3.3%.
Property in the UK is quite variable. Depends where you look at. That's why you need to have local data for what you're going to do.
The gap between the fastest region and the slowest is 8.2 percentage points. In the same country, in the same month, under the same interest rates.
The capital question nobody asks first
Look at the average price rather than the growth for a moment. London is £550,037. The North West is £221,445. The North East is £166,943.
That is not a small difference in lifestyle. It is a different business model. The capital that buys you one property in London buys you three in the North West — and remember those are averages, so the entry point is lower still.
We completed on a two-bed at £91,000 recently. Against a London average of £550,037, that is not half the price. It is a different order of magnitude, and it is the whole argument for spreading capital across several properties instead of parking it all in one.
Go one level down and the differences get bigger
Regions are still an average. Open the West Midlands on the map and you will find Shropshire at -1.3% sitting in the same region as Staffordshire Moorlands at +7.1% — while the West Midlands as a whole reads a calm +1.5%.
Open the North West and the spread is just as wide: Trafford +9.6%, Burnley +8.6%, Hyndburn +8.5% — and Tameside at -0.1%, flat, a few miles from all of them.
Across England, 295 councils have a published figure this month and 85 of them are falling. So "house prices are going up" and "house prices are going down" are both true statements this month. Neither one tells you what to do.
Liverpool, and what the number does not show
Liverpool is up +8.1% over the year, average price £189,036. That is where we invest, and I will tell you what the index cannot: on the ground it feels stronger than 8.1%.
We are putting purchase prices, sometimes 10, 20%, 30% above the asking price, and still we don't get the properties that we want to get.
That is not the ordinary stock. Those you can find all day. It is the high-potential ones — the buildings with value hidden in them, where a conversion or a change of use is possible — and the competition for those is gigantic right now.
Money is arriving from outside the UK and from inside it. The government is leaning on private investors to deliver housing, which is pushing the same properties up. And growth attracts growth: investors see numbers like these, decide they want in, and make it harder for everybody.
Why this map may disagree with the headline you read
You will see other numbers this month, and some of them point the other way. That is not one of us being wrong. It is two different measurements.
The UK House Price Index counts completed sales at the Land Registry, cash buyers included, and runs about two months behind. Lender indices like Lloyds or Halifax measure mortgage approvals on their own lending, so they see a later part of the cycle and arrive sooner — and they do not see cash buyers at all.
Use the lender index for the mood. Use this one when you need the figure for a specific place to stand up. It is the only one that goes down to your council.
What I would actually do with this
Start with the council, not the country. Before you look at a single property, look at what your target council did over twelve months, and whether the region around it agrees.
Then check the entry price against your capital. A +9.6% rise on £400,688 and a +8.6% rise on £135,012 are not the same investment, even though the percentages look similar.
And hold it lightly. Prices move in cycles — slower than shares, but they move.
This is cyclical. Prices of property go up and down like any other investment, just in a slower cycle.
What matters over a decade is that you bought in a place with real demand, at a price that survives a bad year, with a strategy that adds value rather than waiting for the market to do it for you. The map tells you where to look. It does not tell you what to buy.
Check your own council
The map is free and it stays on the site — I refresh it each month when the new index lands, so it is worth bookmarking rather than screenshotting.
And if you want the tools I use to work out whether a specific deal is worth doing — the cash flow, the refinance, the true cost of a project — the UK Property Investor Toolkit has 15 of them. It is 99p, and the 99p is shipping only, because we post you the physical toolkit.
Get the UK Property Investor Toolkit →
Figures are from the UK House Price Index for July 2026, published by HM Land Registry and the ONS on 16 September 2026. They are provisional and revised for twelve months as more sales are registered. Prime central London boroughs move on very low sale volumes, so treat the largest falls there as the index's reading rather than a valuation of any particular flat. This article is general information, not financial advice.